US‑based biotech project
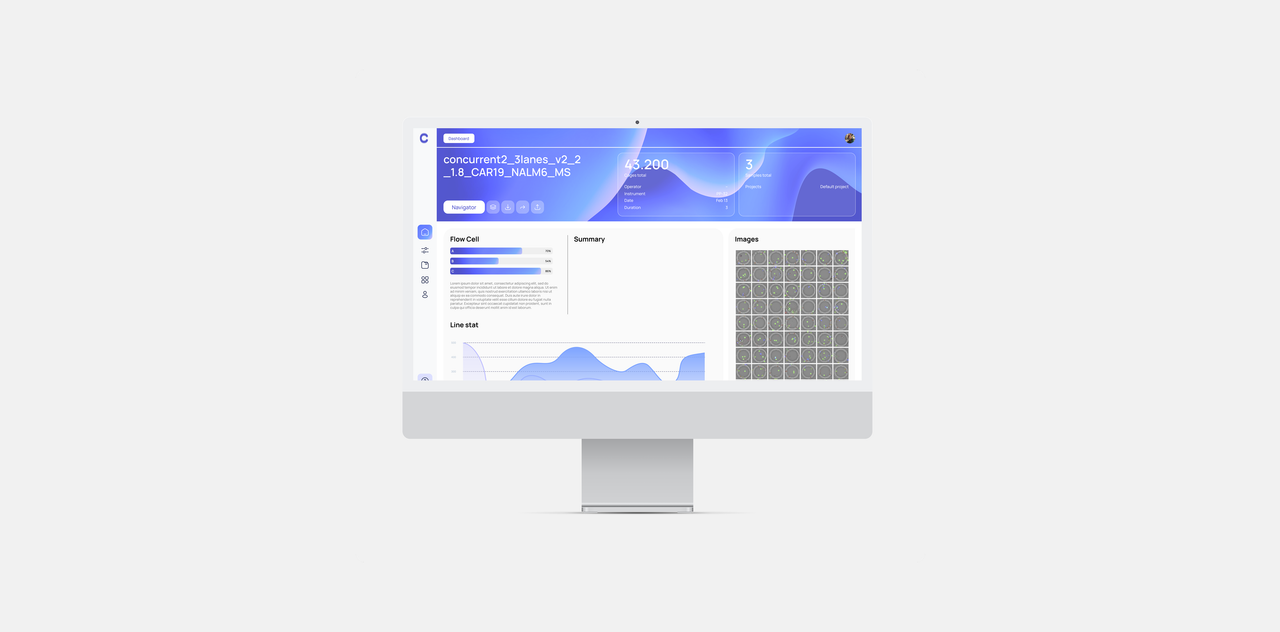
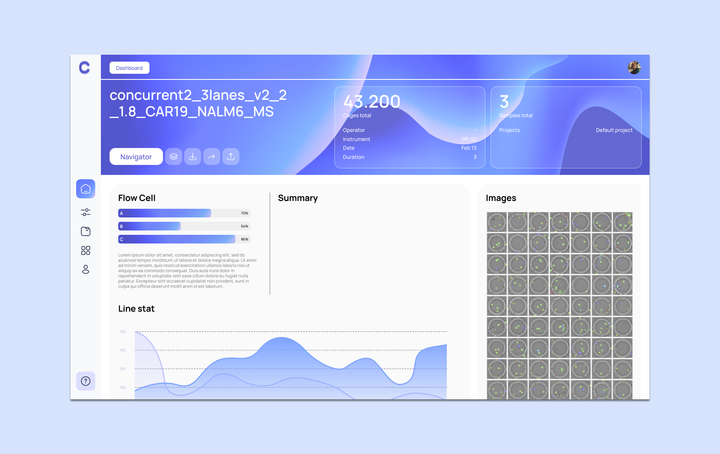
We developed an interface for microscope operation and scientific data analysis. The project started with a set of raw files (CSV files and folders with images) and evolved into a suite of products: a desktop Electron application for managing the scanning process and a web platform for analysis and visualization.
About client
The client is a biotechnology company based in California, USA. It combines the scale and resources of a large enterprise with the flexibility and agility of a startup, developing tools for research.
Due to an NDA, the company’s name cannot be disclosed, but the main goal of our work was clear: to accelerate research and eliminate routine tasks related to file processing.
About project
At the start, researchers had no interface. The data consisted of dozens of CSV files and hundreds of images, making it difficult to work with and analyze.
The goal was to build a system that would unify all processes—from displaying the scan map to post‑analysis and visualization.
We began with an MVP called the “Navigator,” which enabled scan map visualization and basic data interaction. Early iterations demonstrated clear value: researchers immediately noted that the time spent working with data was reduced by nearly half.
After validating the hypothesis, we moved on to developing full‑fledged products: a desktop application and a web platform.
Request
The client wanted a solution that could be launched quickly and then further developed. The key requirements were a fast MVP delivery, a user‑friendly interface for researchers, a desktop application for microscope control, and a separate web platform for data analysis.
Performance was a critical requirement: the system had to reliably process hundreds of thousands of data points and dozens of high‑resolution images without failures.
Tools
The frontend was built with React and TypeScript, with styling implemented in SCSS. For visualization, we used Plotly along with custom GLSL shaders for image layer compositing.
Leaflet was initially used for map rendering, later replaced with OpenSeadragon for greater flexibility. The desktop application was built with Electron, authentication was handled via Cognito, and data was delivered through the client’s API.
This tech stack provided a balance between flexibility, performance, and scalability.
Team
A team of five specialists was involved in the project. Two frontend developers were responsible for the interface and API integration. The designer focused on user flows, making a complex product intuitive for researchers.
The technical lead oversaw the architecture and code quality, while the project manager coordinated processes and communication. On the client’s side, researchers worked closely with us throughout the project, testing the product and providing feedback after each iteration.
What we did
We progressed from a simple MVP to a comprehensive system. The MVP, called the “Navigator,” allowed users to view scan maps and correlate images.
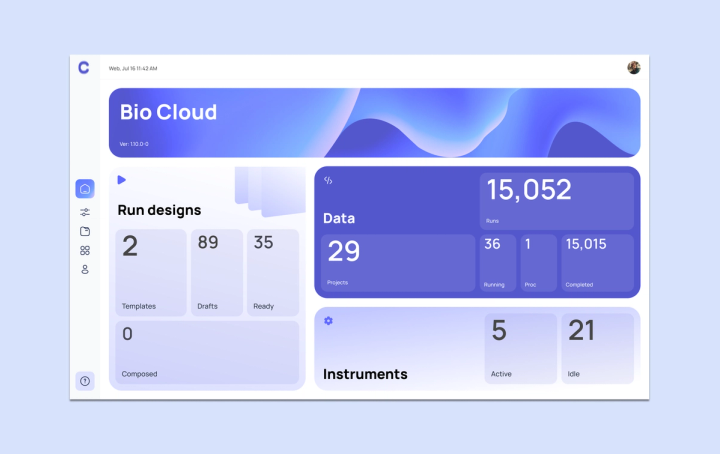
We then developed a desktop application that not only visualized results but also controlled the scanning process itself, enabling users to configure parameters and save experiment “recipes.” The web platform became a space for post‑analysis and visualization.
Handling large datasets was a key challenge. In some cases, charts contained over 200,000 data points, making the interface difficult to use. We addressed this by offloading heavy rendering to the server, achieving stable performance even with the largest datasets.
Result
Researchers received two products that fundamentally transformed their workflow: a desktop application and a web platform. Data analysis time was reduced by an average of 3–5x, and working with large datasets was no longer a challenge.
Scientists can now instantly visualize results, scale charts without delays, and focus on research rather than routine file processing.